Assets by market
Below are two charts that show the number of assets in the 6 main central and north Florida markets and I provide commentary on each market based on those numbers. If numbers make you fall asleep, just read my observations. There are some interesting and surprising bits of info. As you look over the charts, think about the relatively low number of assets that actually exist for acquisition. For example, if you’re a student housing investor that buys 300+ bed projects (100+ units) and you want to expand in Gainesville, there are only 29 assets in the entire market. How many of those have sold in the last 3-5 years? How many are refinancing right now? How many are owned by long term holders??

Gainesville (over 100 units)
- There are 126 assets over 100 units in the market composing 28,033 total units. Of those, 64% are market rate, 23% are student housing, and only 13% are affordable housing.
- Most non-college towns have between 70-80% of assets as market rate so it is no surprise Gainesville is lower.
- What is surprising is that Gainesville has by far the lowest percentage of assets in affordable housing, which if you live in Gainesville you know is a hot topic. On average, most markets have about 25% of their assets in affordable housing.
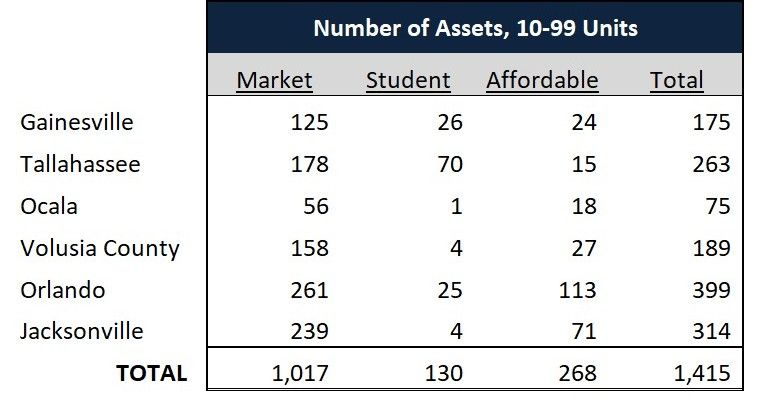
Gainesville (10-99 units)
- The 10-99 unit chart tells much of the same story. The differences are that there is nearly 40% more properties in this size range than the 100+ unit range, which is found mostly in the market rate category. The student housing and affordable numbers are about the same as the 100+ units with the same very low affordable housing number issues.
Tallahassee (over 100 units):
- There are 145 assets over 100 units in the market composing 28,391 total units. Of those, only 41% are market rate, a whopping 43% are student housing, and only 16% are affordable housing.
- As stated above, most non-college towns have between 70-80% of assets as market rate so it is no surprise Tallahassee is lower. In fact, they have the lowest market rate composition of the 6 markets and by far the highest student housing composition.
- Tallahassee also has a very low percentage of assets in affordable housing (16%). Most markets have about 25% of their assets in affordable housing.
Tallahassee (10-99 units):
- The 10-99 unit chart has some pretty big differences. There is nearly three times more 10-99 unit market rate properties than the 100+ unit properties. But the number of student and affordable projects are about the same.
Ocala (over 100 units):
- There are only 25 assets over 100 units in the market composing 6,075 total units. Of those, 56% are market rate, there is no student housing, and 44% are affordable housing. In a market like Ocala, where the population is small and there are fewer high paying jobs, it isn’t unusual to have a higher percentage of affordable housing projects.
Ocala (10-99 units):
- The 10-99 unit chart doesn’t have many surprises. There are three times more 10-99 unit properties than 100+ unit properties with the bulk of them falling in the market rate sector.
Volusia County (over 100 units):
- Volusia County is composed of Daytona Beach, Ormond Beach, New Smyrna, Port Orange, Deland, Deltona, and Orange City to name the larger cities.
- There are 88 assets over 100 units in the market composing 18,127 total units. Of those, 72% are market rate, only 2% are student housing, and 26% are affordable housing. This is a very typical even distribution in non-college counties with average employment opportunities.
(Volusia County 10-99 units):
- There is two and half times more 10-99 unit market rate properties than 100+ unit properties, while the number of student properties are about the same. In fact, among all 6 markets Volusia County has the highest percentage of market rate properties with 84% in this category.
- While there are more assets overall in this size category, only 14% are affordable housing.
Orlando (over 100 units)
- Incredibly, there are 723 assets over 100 units in the market composing nearly 200,000 total units. Of those, 72% are market rate, 3% are student housing, and 24% are affordable housing.
- When you combine all 6 markets, Orlando makes up 51% of all market rate properties and 51% of all affordable housing properties. That means Orlando has more market rate and affordable units than the other 5 markets combined!
- With the University of Central Florida’s 66,000+ enrollment, Orlando has nearly as many 100+ unit student housing assets as Gainesville; home of the #7 ranked university in the country.
(Orlando 10-99 units):
- There are about half the number of 10-99 unit properties in Orlando as there are 100+ unit properties.
- The are 25 student properties, and affordable housing has over 100 properties.
Jacksonville (over 100 units)
- There are 381 assets over 100 units in the market composing 93,624 total units. Of those, 74% are market rate, 1% are student housing, and 25% are affordable housing.
- Jacksonville is the second largest market rate and affordable market among the 6 central and north Florida markets. When you combine all 6 markets, Jacksonville makes up 28% of all market rate properties and 28% of all affordable housing properties over 100 units! Between Orlando and Jacksonville combined, they make up nearly 80% of all market rate and affordable housing assets!
- With the two small public colleges, UNF and Florida State College of Jacksonville, there isn’t much need for dedicated student housing.
(Jacksonville 10-99 units):
- Jacksonville has almost as many 10-99 unit market rate properties as Orlando does, despite Orlando having significantly more 100+ unit market rate properties.

